About

About

How did we get here?
PIA NJ/NY Tradeshow, June 2014

Bootstrapped

We started small, three states, at zero. We knew if we built a product with excellent market-fit, the business will follow, not the other way around. While it seemed normal in 2014, this is the ultimate reason we are able to do what we do so well. We are not beholden to PE or VC shareholder return, no board members to appease. We do not have to make unkeepable promises or come up with gimmicky, benefit-less features. Our time is spent improving the product for our customer, because that is who funds us. As an aside, we had a Notes feature, so the bar started pretty low. 

To the left, our first tradeshow (Atlantic City, jealous?). Note the backing falling off the structure.

U/I 2014-2016

Prospecting Database Solution for Commercial Insurance Agents

What a mouthful. But, we needed a slogan and it was to the point (no one gets it right the first go). The idea is simple. There is insurance relevant B2B data out there that can enable a Producer to get more done with their time. It’s not a novel idea, but we knew it could be done better.
Policy expiration date is just the start. Carrier markets have cyclical risk appetites, sales teams have revenue demands, and the only thing that’s finite is time. But the current policy is only a snapshot. Does the insured move around, has their rate and premium increased in tandem, what is the incumbent’s market share? The answer to these questions lead to better opportunities.
U/I 2.0 2016-2021

v2 - All the Data, One View

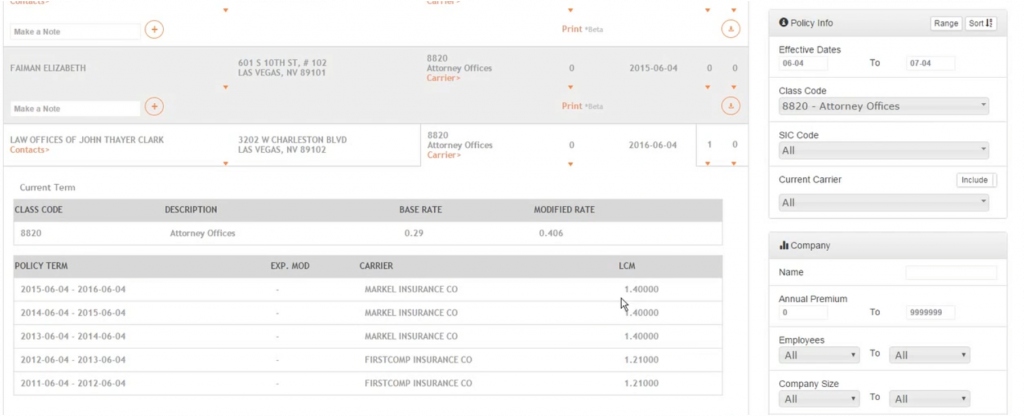
It might not seem like much, but there are few sales resources then or today providing such a comprehensive view without the use of tabs, which do have their place. 

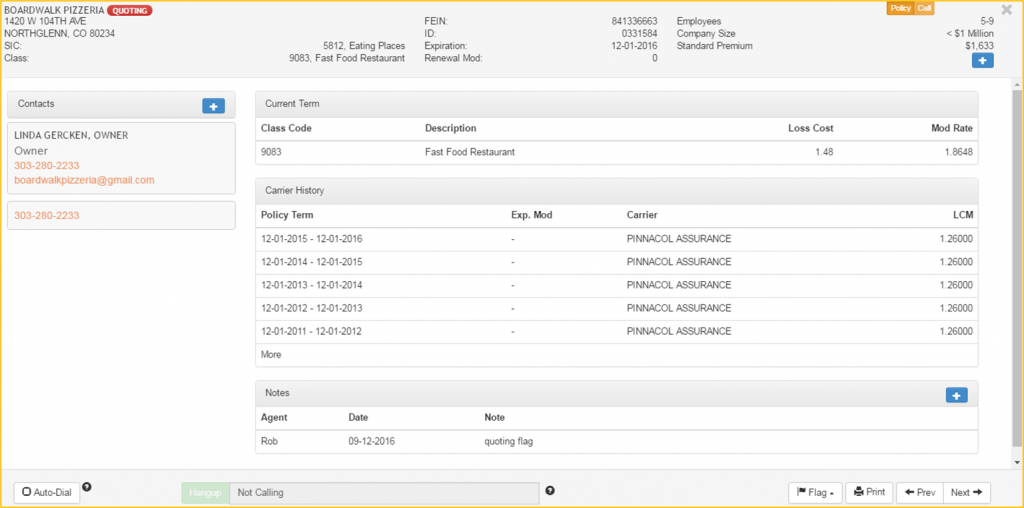
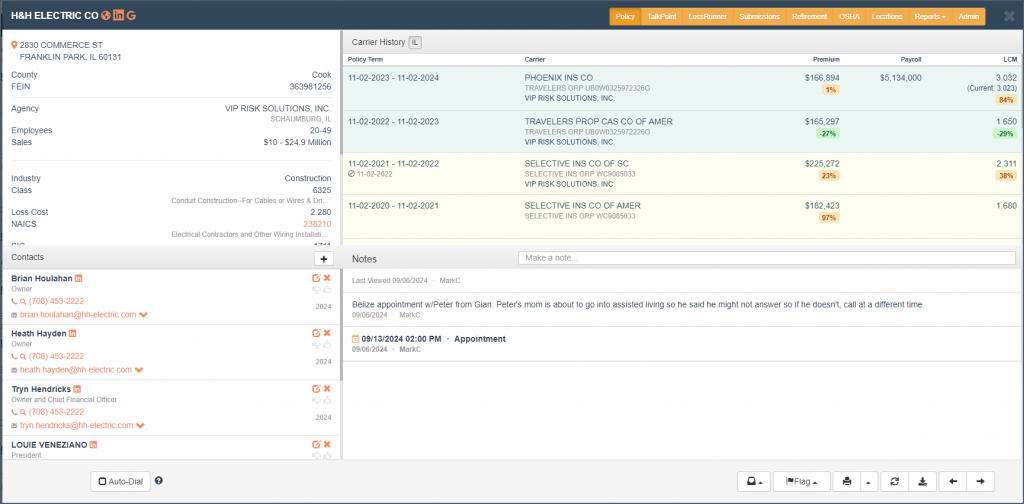
We made a series of functionality enhancements including historical values for LCM filings and WC Premium, added Carrier Groupings, and the introduction of CRM functionality like adding/editing contacts, pipeline flags and a Pipeline View to keep track of current opportunities. As team sizes grew, we created AgencyDash for team leaders to have an easy way to view activity. 

In the later rounds (when we all had too much time on our hands), we began cross-referencing Employee Benefits data for employee estimates, contact intel and the data itself for a more rounded profile. By the end, we also figured out how to begin analyzing the data, for Carrier and Class benchmarking. 

U/I 3.0 2021-Present

v3 - the Window Pane

An agent quickly sees the insured does Underground Cable installation. In the history, the incumbent agent moved this account from Selective to Travelers 2 years ago (on the ball), resulting in a 27% premium decrease, $5MM in payroll with a flat renewal (despite a sharp rate increase), and has four contacts available. All in one view. As a payroll history is developed, it will be very telling in situations like this (new data as of 2024). 

We also figured out how to handle multi-state businesses better and how to correctly define their domiciled state. This led to a Locations Schedule that can be downloaded in spreadsheet form.  PEO policy reporting was better understood and targeting options were added. Contained in the tabs (told you) are additional data sets we’ve used to provide a better profile – Health/Retirement, OSHA violations and DOT filings. Most summarized on the main tab. Reports were created to show who’s winning and losing, in what class, and to who. Class and industry specific rate trends. Mobile app, integrations, automations. But it’s still getting better.

Generate Leads. Win New Biz.

0
Commercial States
0
Business Listings
0
Benefits States